Backfills
Feature in Beta
This new user interface for managing backfills is currently in development and is only available to select customers.When you publish or make a recipe change in Switchboard, the new recipe will be applied to all future data going forward from the date of the change.
In some cases, you may need to retrieve data from past dates or update existing data based on a new transformation. Every connector in Switchboard has its own default date range for data retrieval. By default, most connectors will retrieve data from the previous day.
If you need data from an earlier date or date range, you can use the backfill functionality. The backfill feature in Switchboard is designed to retrieve data from sources that provide daily files or have a daily reporting schedule.
Backfill Landing Page
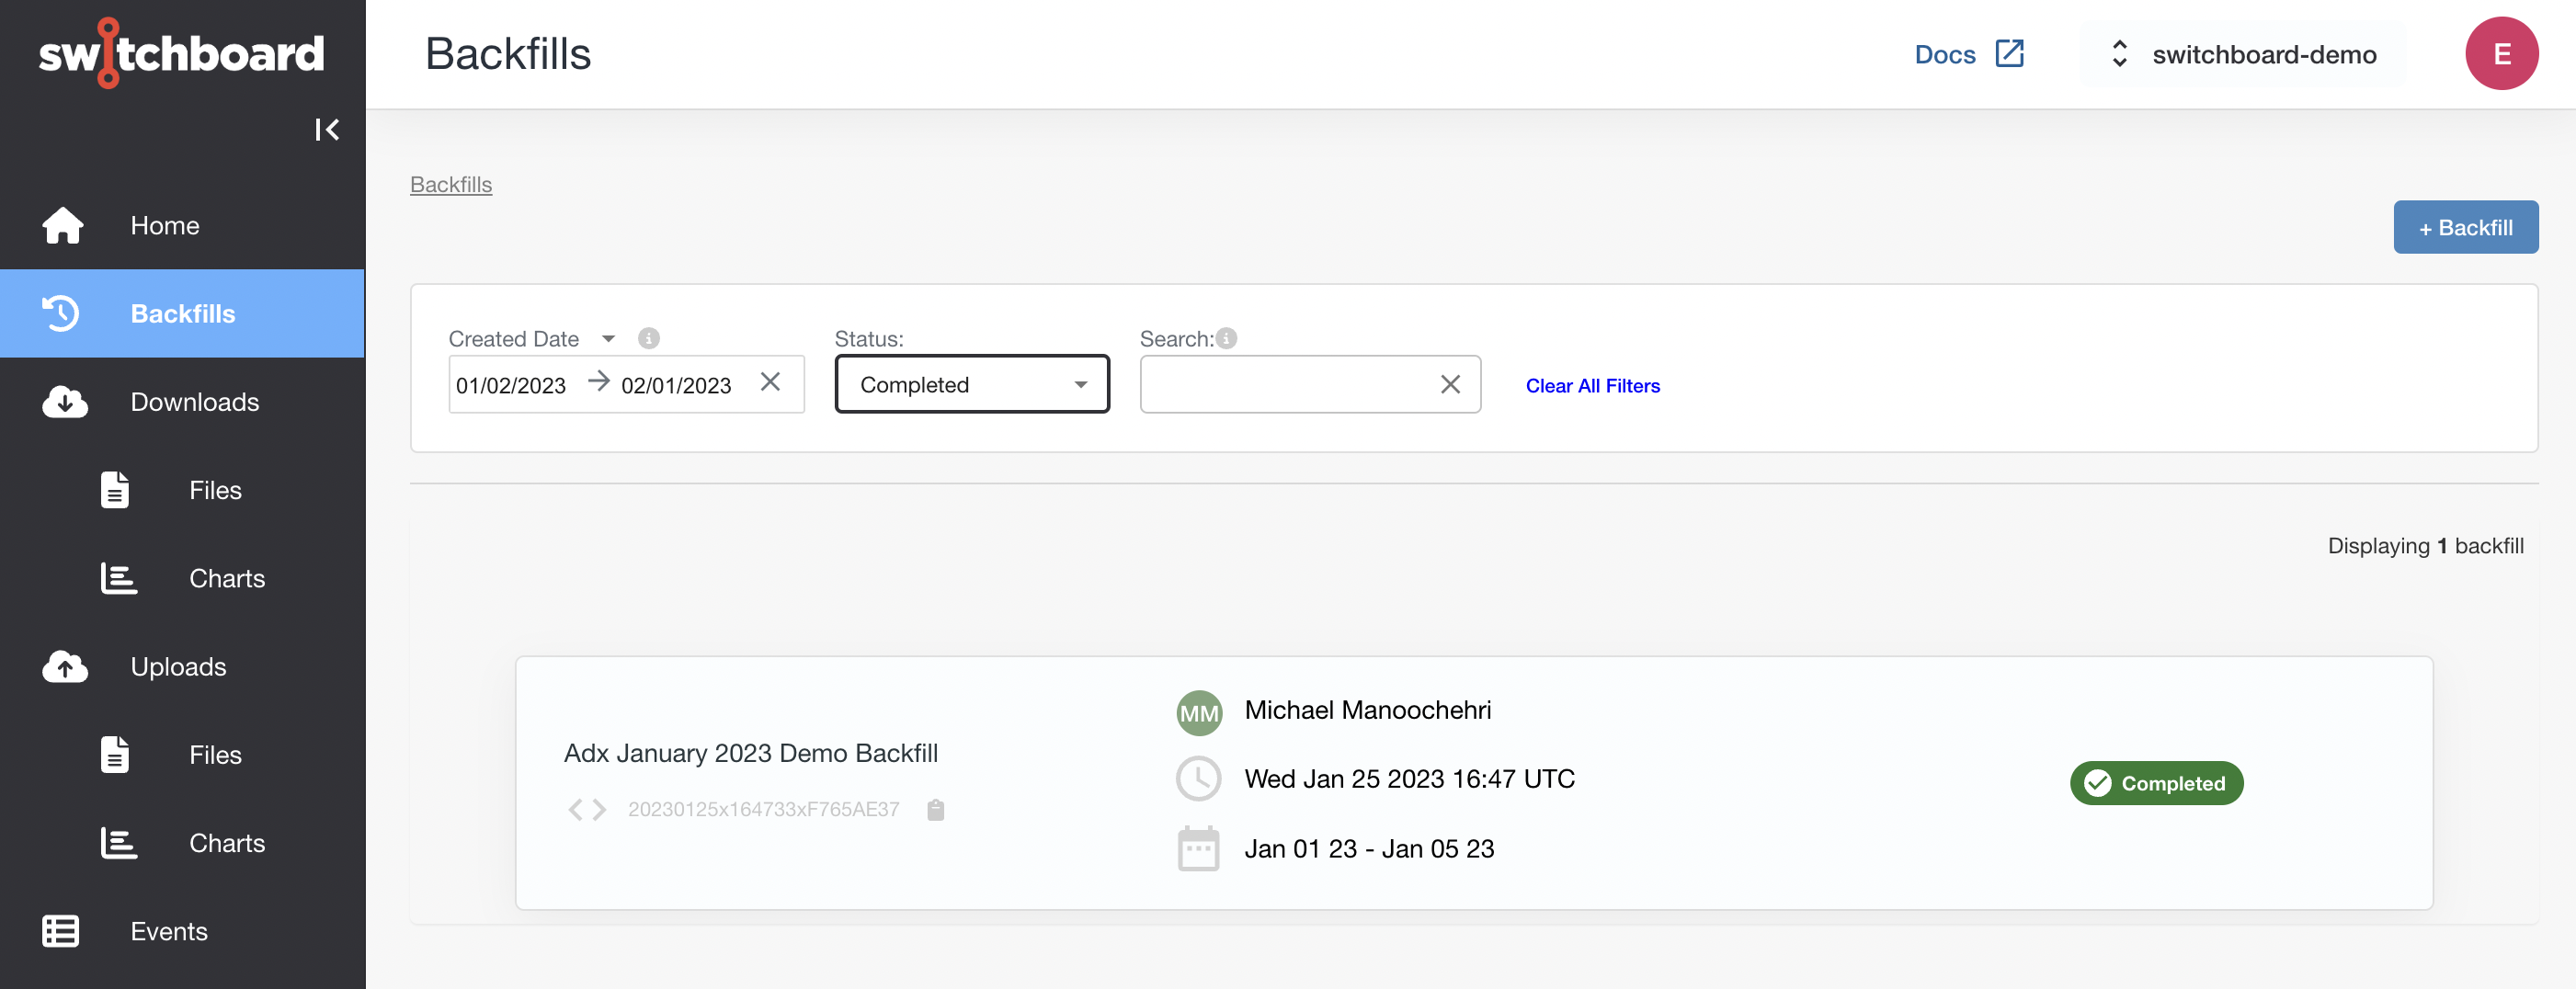
To initiate a backfill, select the “Backfills” option from the left land navigation.
The landing page for the backfills section will display all the previous backfills you have initiated, which may be filtered by status, search keyword, or date range.
You may toggle the selected date range between the date the backfill run was created (the Created Date) or the date of the data from backfill itself (The Report Date).
Creating a Backfill
To initiate a new backfill, click the “+Backfill” button.
This will launch a modal dialogue with a wizard to walk you through the steps.
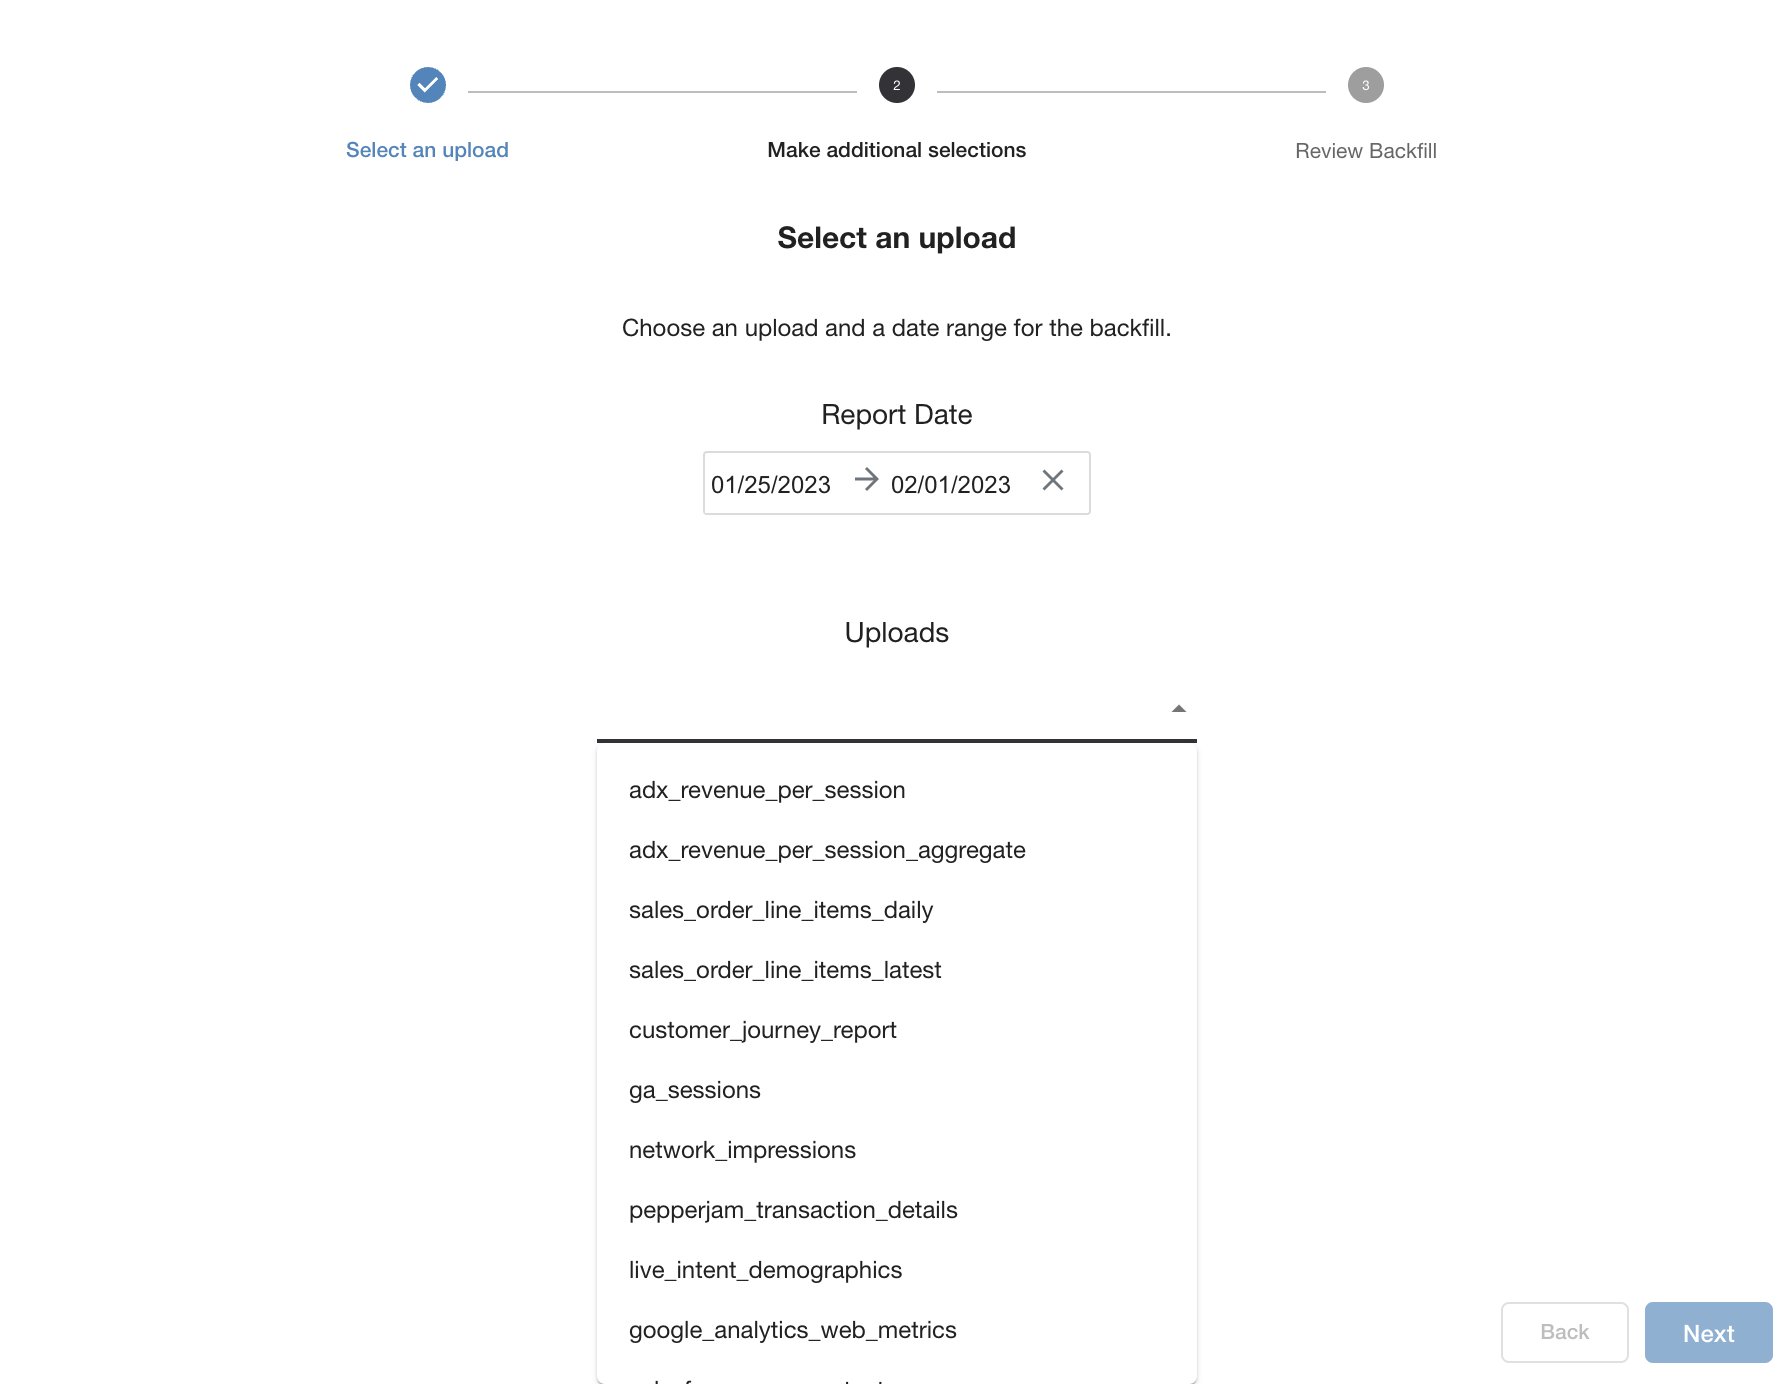
Selecting a Report Date and Upload
The first step requires you to provide a date range for the time period from which you want to import data.
Backfill Limitations
Note that while Switchboard does handle longer term backfills (e.g. over a year), we are limited by vendor API capabilities / quotas that are out of Switchboard's control.You will also select an upload using the list box control populated with export locations defined in your scripts.
Making Additional Selections
The next step of the backfill wizard will allow you to select additional destinations to populate with your backfill.
In many cases there will be nothing to select because the script is quite simple so you will be taken to the final step of the wizard.
More Complex Scenarios
In some cases your data may be sourced from multiple sources. Having multiple sources is not atypical given Switchboard’s transformational capabilities.
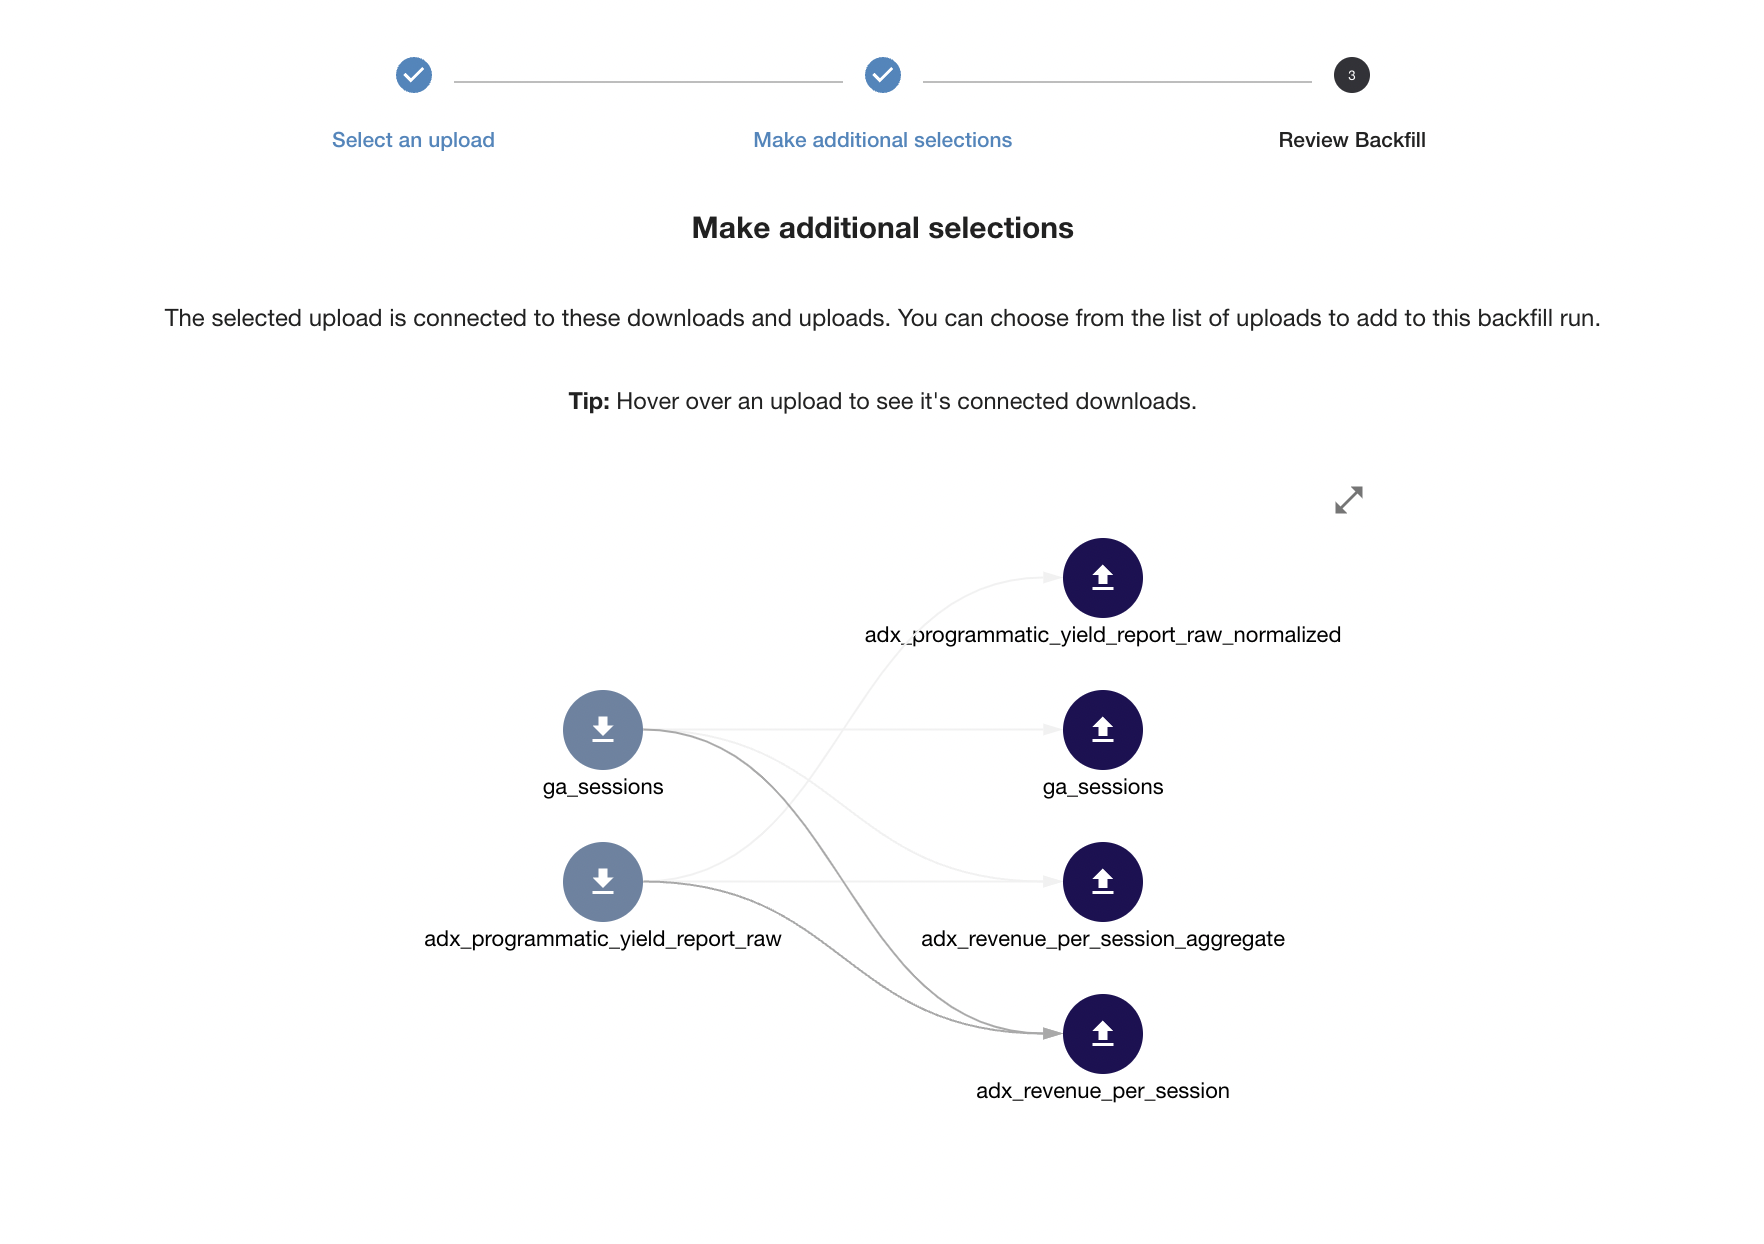
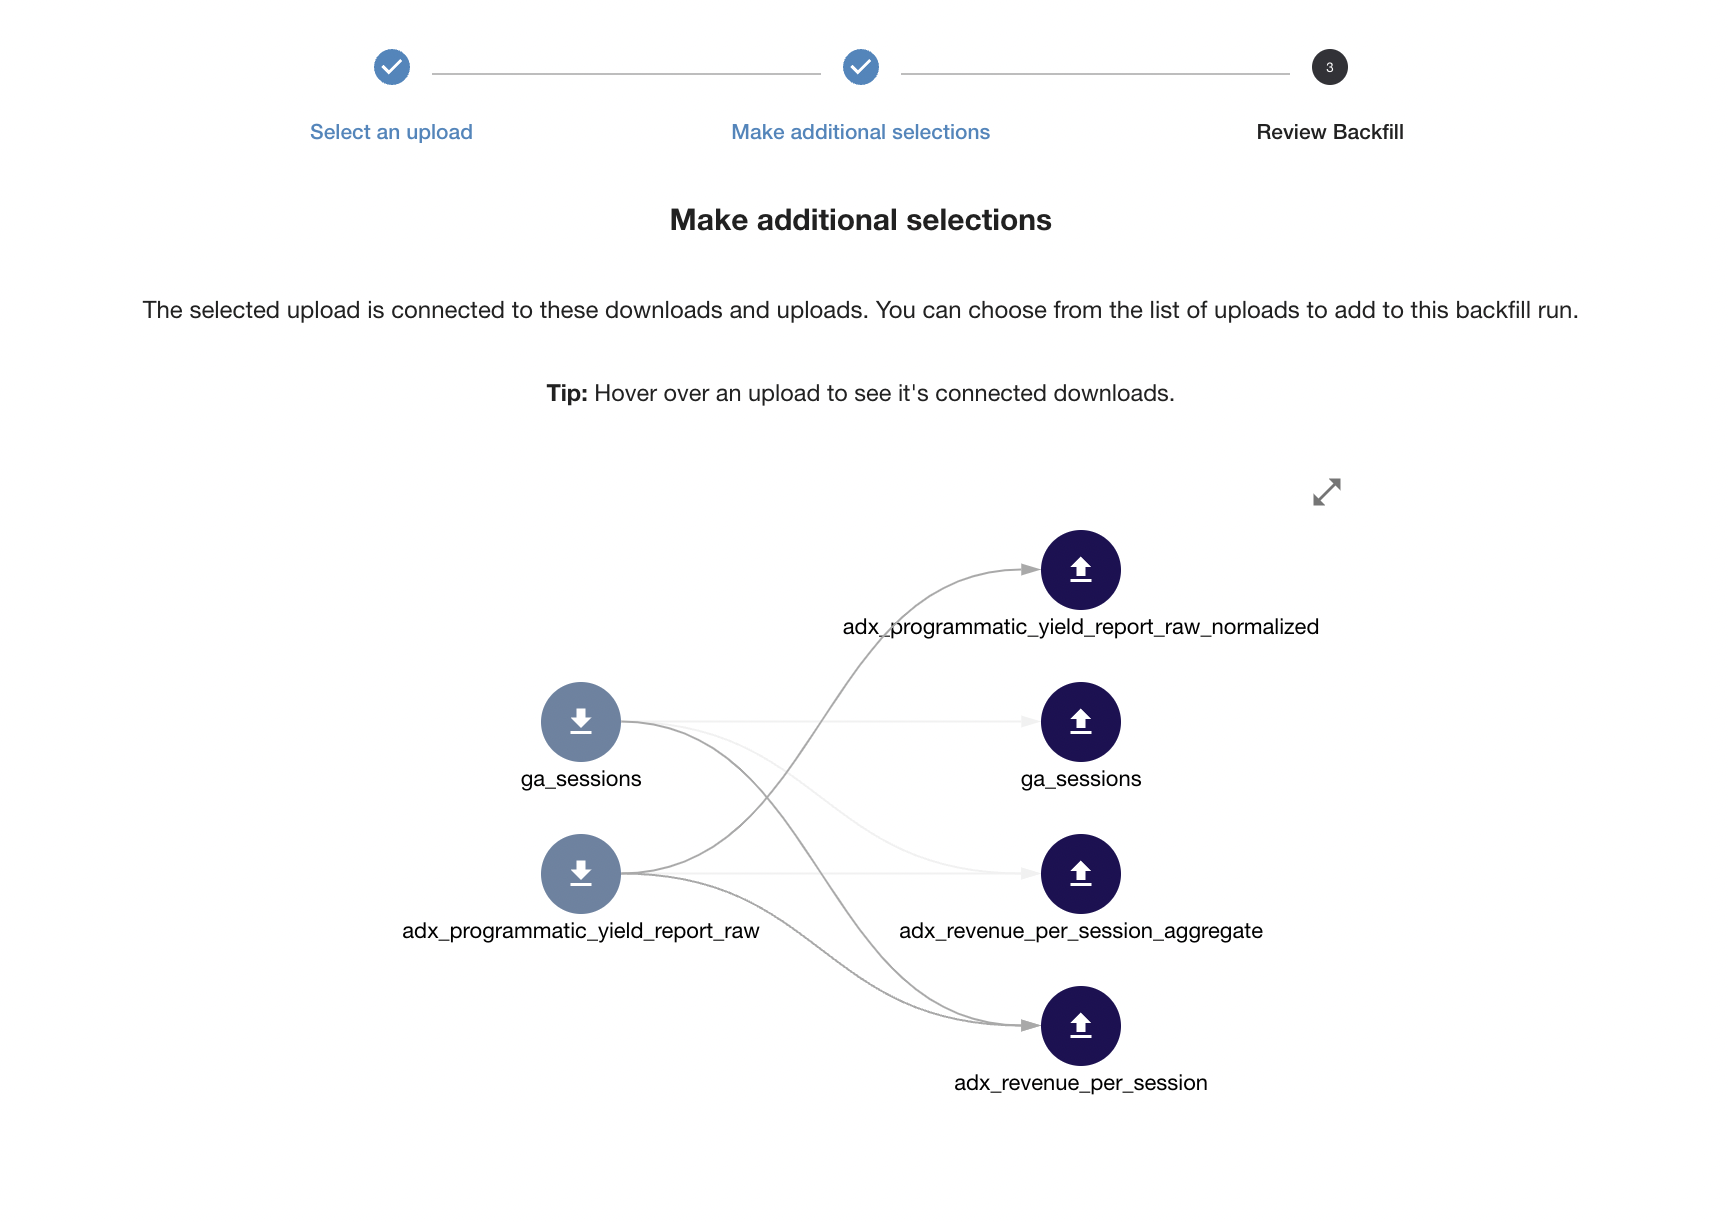
This is illustrated below in a scenario where data is being pulled from Google Analytics ( the ga_session table ) and AdExchange (adx_programmatic_yield_report_raw) on the left hand side and put into the export table adx_revenue_per_session which we selected, displayed at the bottom of the right hand side.
The relationship between all the destinations and their sources is shown by the arrow connecting the two.
Note that only the destinations linked by the darkened arrows will be populated by this backfill, as that is the only one considered selected. The light gray arrows indicate additional relationships between those sources and other destinations that have not been selected — though it is possible to add them as well (see below).
Below is the import script that pulls in the data from Google Analytics which puts it into a table called ga_sessions.
import ga_sessions from {
    type: "google_analytics";
    key: "google_analytics_demo_service_account_key";
    view_ids: ["156784291",
               "177019894"];
    dimensions: ["ga:date",
                "ga:country",
                //"ga:userType",
                "ga:referralPath",
                "ga:fullReferrer",
                "ga:deviceCategory",
                "ga:hostname",
                "ga:pagePath"];
    metrics: ["ga:users",
              "ga:sessions",
              "ga:bounces",
              "ga:bounceRate",
              "ga:sessionDuration",
              "ga:hits",
              "ga:pageviews",
              "ga:pageviewsPerSession",
              "ga:uniquePageviews"];
} using {
    viewId: integer;
    ga_date: datetime("YYYYMMdd");
    ga_country: string;
    //ga_userType: string;
    ga_referralPath: string;
    ga_fullReferrer: string;
    ga_deviceCategory: string;
    ga_hostname: string;
    ga_pagePath: string;
    ga_users: integer;
    ga_sessions: integer;
    ga_bounces: integer;
    ga_bounceRate: float;
    ga_sessionDuration: float;
    ga_hits: integer;
    ga_pageviews: integer;
    ga_pageviewsPerSession: float;
    ga_uniquePageviews: integer;
};

export ga_sessions to {
    type: "bigquery:load";
    format: "json";
    key: "switchboard_demo_google_key";
    project: "switchboard-demos";
    dataset: "google_analytics_360";
    table: "ga_sessions_YYYYMMDD";

    //test_table: "ga_sessions";
    //test_dataset: "development";

    primary_source_name: "ga_sessions";
    truncate: true;
};
Below is an import that pulls from Google AdExchange and pulls it into a table called adx_programmatic_yield_report_raw. Note that it does some manipulation of the data to convert revenue into dollars, creating a new table called “adx_programmatic_yield_report_raw_normalized”.
import adx_programmatic_yield_report_raw from {
    type: "gam:report";
    key: "google_service_account_key_demo";
    network: "4624";
    api_version: "v202205";
    dimensions: [
        "DATE",
        "COUNTRY_NAME",
        "COUNTRY_CODE",
        "AD_UNIT_NAME",
        "AD_UNIT_ID"

    ];
    delay_hours: 3;
    attributes: [];
    columns: [
        "AD_EXCHANGE_LINE_ITEM_LEVEL_CLICKS",
        "AD_EXCHANGE_LINE_ITEM_LEVEL_REVENUE",
        "AD_EXCHANGE_LINE_ITEM_LEVEL_IMPRESSIONS",
        "AD_EXCHANGE_TOTAL_REQUEST_ECPM"
    ];
    filter: "PROGRAMMATIC_CHANNEL_NAME != '(Not applicable)' AND DEMAND_CHANNEL_NAME = 'Ad Exchange'";
} using {
    date: datetime;
    country_name: string;
    country_code: string;
    dfp_ad_unit: string;
    dfp_ad_unit_id: integer;
    country_id: integer;
    clicks: integer;
    estimated_revenue: float;
    impressions: integer;
    ecpm: float;
};


// Split Ad Unit List, convert revenue to dollars

table adx_programmatic_yield_report_raw_normalized is
    select
        << raw.$c as "$c" for c in raw,
        split(replace(dfp_ad_unit, literal ' ', literal ''), literal " » ")  as dfp_ad_unit_list,
        estimated_revenue/1000000:float as estimated_revenue_dollars
    from adx_programmatic_yield_report_raw as raw;


export adx_programmatic_yield_report_raw_normalized to {
    truncate: true;
    type: "bigquery:load";
    format: "json";
    project: "switchboard-demos";
    dataset: "google_adx";
    table: "ad_exchange_YYYYMMDD";

    key: "switchboard_demo_google_key";
    primary_source_name: "adx_programmatic_yield_report_raw";
};
Below shows the adx_revenue_per_session table being sourced from for the Google Analytics data (from ga_sessions) as well as the Google Adx data (from adx_programmatic_yield_report_raw_normalized).
table adx_revenue_per_session is
    select
        ga.ga_date as date,
        ga.ga_country as country,
        ga.ga_sessions as sessions,
        adx.impressions as impressions,
        adx.estimated_revenue_dollars as revenue
    from
        ga_sessions as ga
    left join
        adx_programmatic_yield_report_raw_normalized as adx
    on
        ga.ga_country == adx.country_name;

export adx_revenue_per_session to {
    truncate: true;
    type: "bigquery:load";
    format: "json";
    project: "switchboard-demos";
    dataset: "google_adx";
    table: "adx_revenue_per_session_YYYYMMDD";
    //test_table: "adx_revenue_per_session";
    key: "switchboard_demo_google_key";
    primary_source_name: "adx_programmatic_yield_report_raw";
};

table adx_revenue_per_session_aggregate is
    select
        date,
        sum(sessions) as total_sessions,
        sum(impressions) as total_impressions
    from adx_revenue_per_session;

export adx_revenue_per_session_aggregate to {
    truncate: true;
    type: "bigquery:load";
    format: "json";
    project: "switchboard-demos";
    dataset: "google_adx";
    table: "revenue_per_session_aggregate_YYYYMMDD";

    //test_table: "ga_sessions";
    //test_dataset: "development";

    key: "switchboard_demo_google_key";
    primary_source_name: "adx_programmatic_yield_report_raw";
};
Adding Additional Destinations
In the example we looked at above, it is possible to select additional destinations to backfill that are associated with the sources you are importing the data from, such as the adx_programmatic_yield_report_raw_normalized.
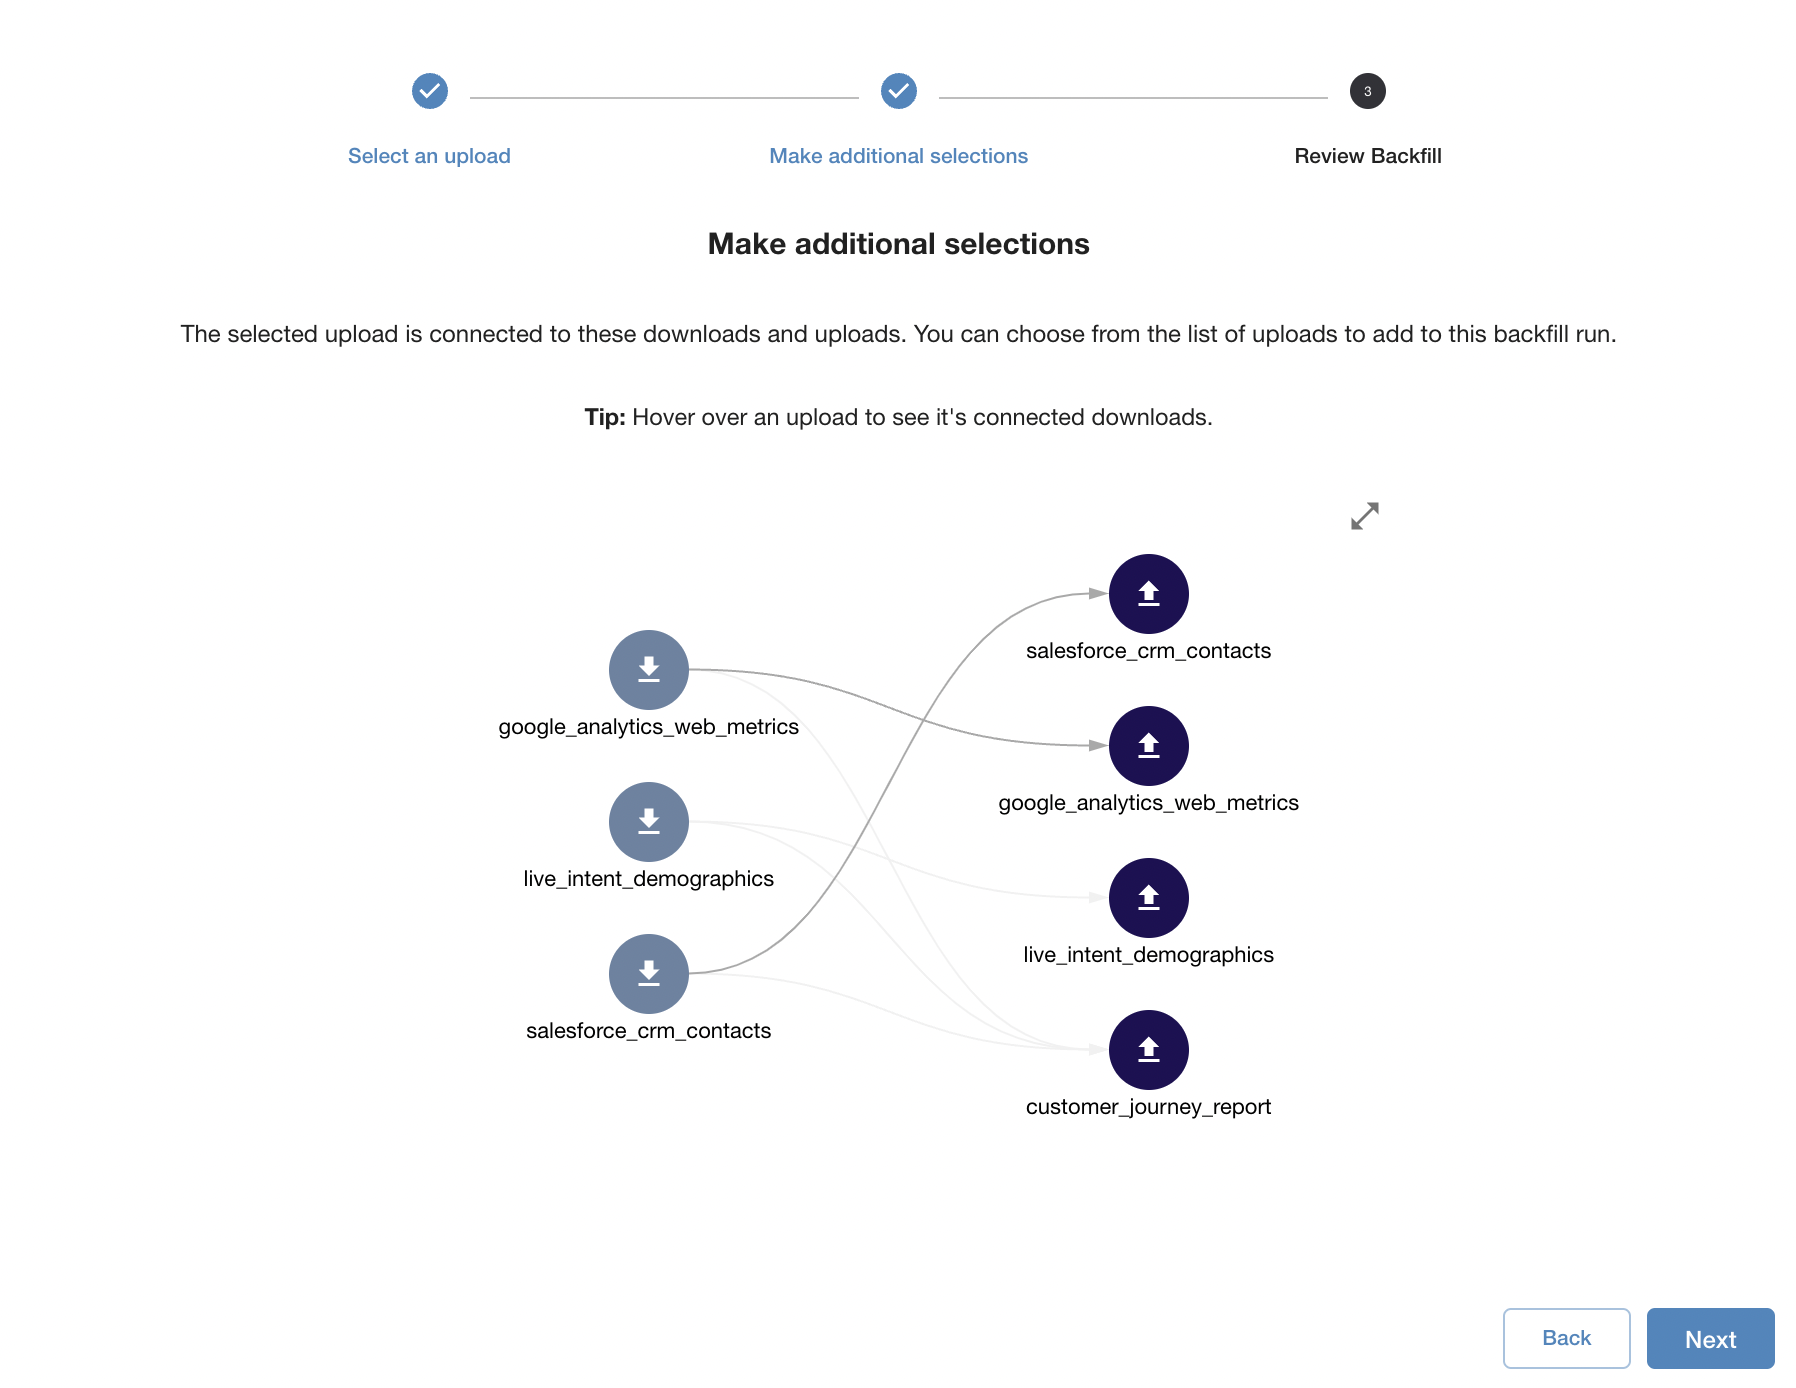
In order to indicate you wish to backfill the additional export location, click on the icon in the right hand column corresponding to that location. The arrows between the source and destination will darken when you hover over a destination, and they will remain in that state if you click on the destination to select it. You can also hover over a download to see all uploads it powers.
To unselect a destination for backfill, click on the icon of a destination to which darkened arrows are pointing.
Sometimes adding a new destination table will require data to be pulled from an additional source.
In the scenario below, the script being referenced as a source is populating a number of destinations from different sources.
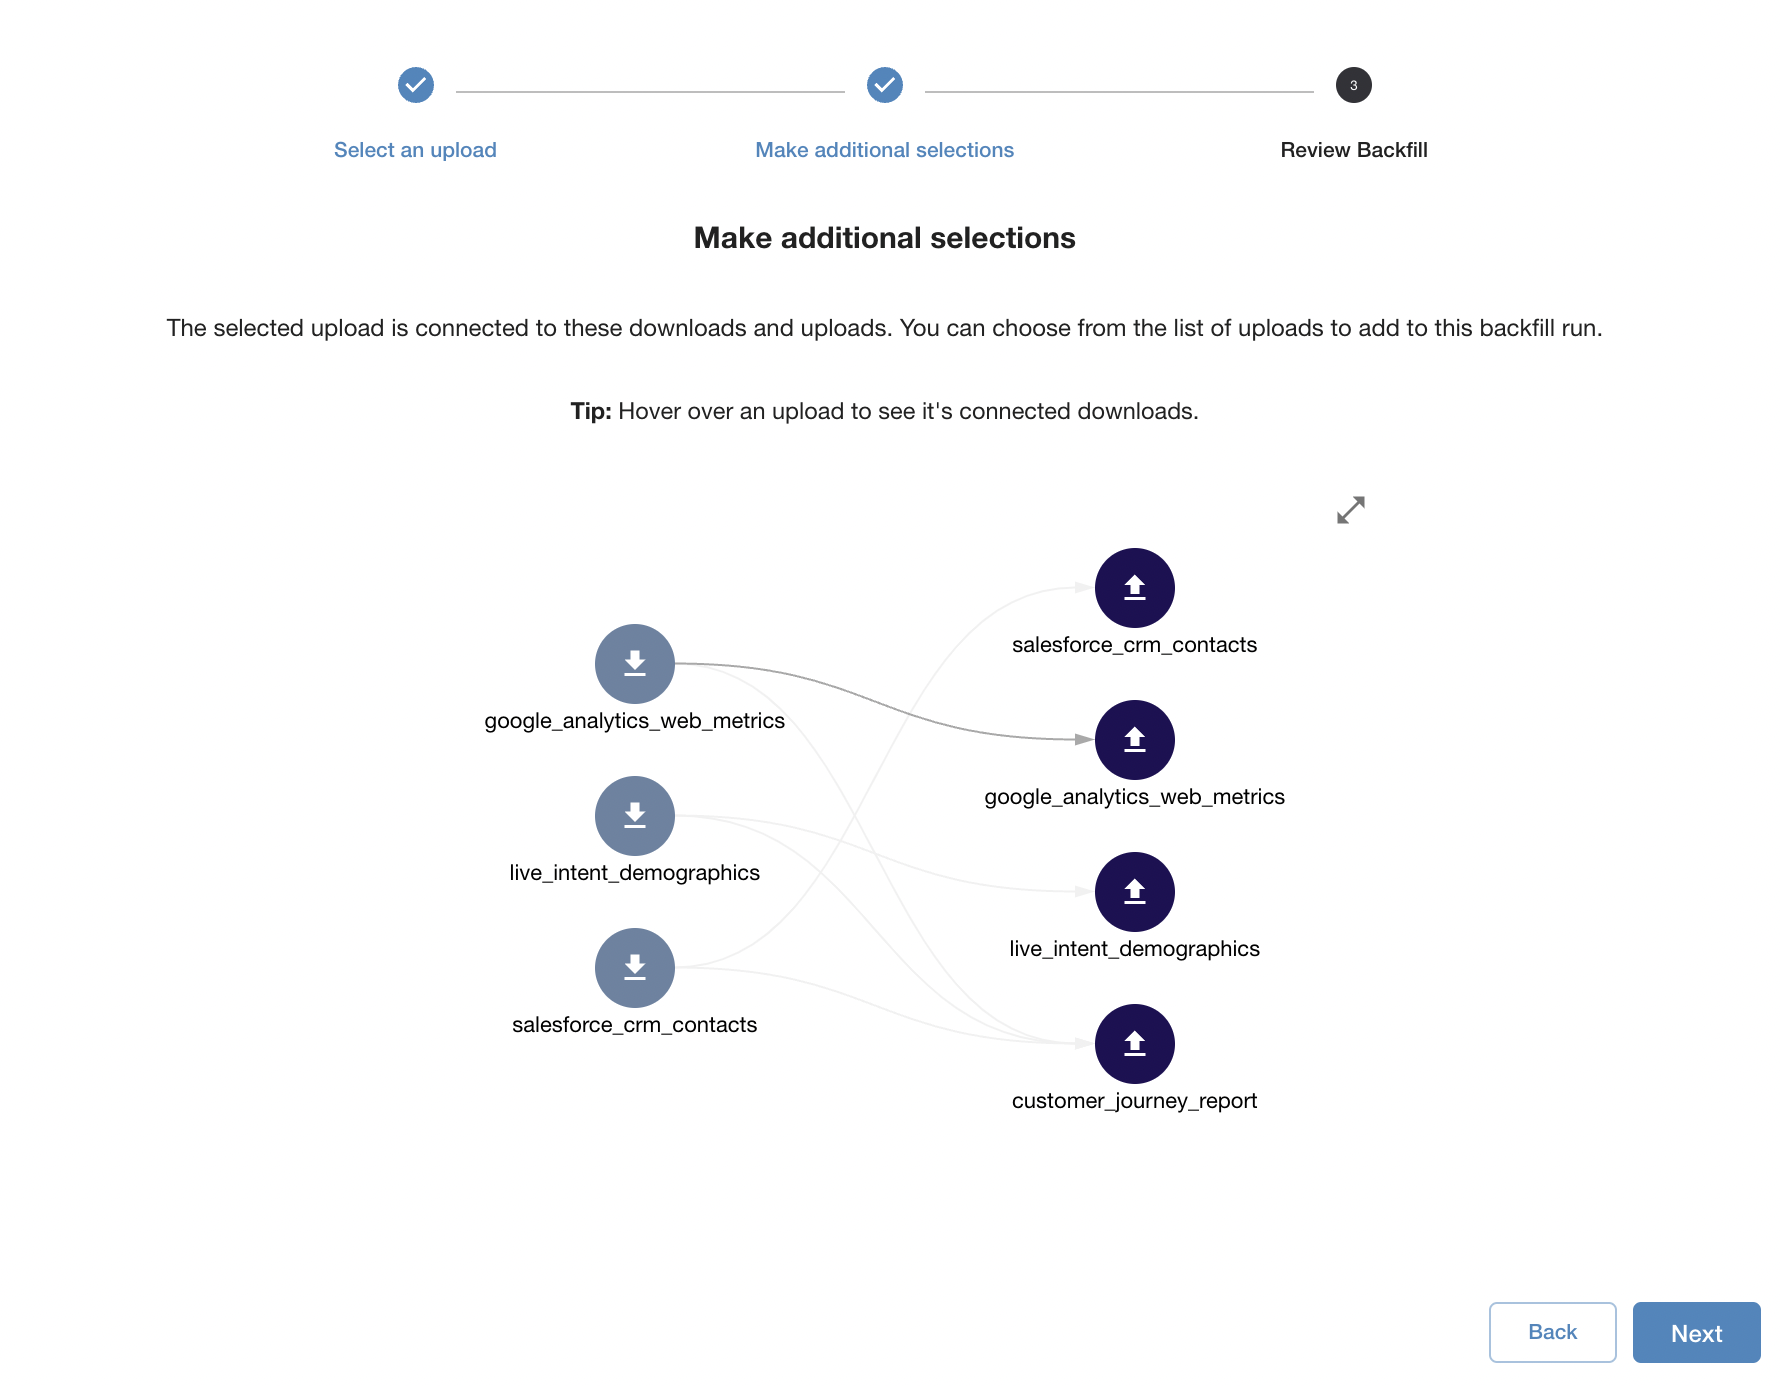
In the example above, selecting the Salesforce CRM Contacts table will require pulling from the salesforce_crm_contacts source in addition to the google analytics web metrics.
Reviewing Your Backfill
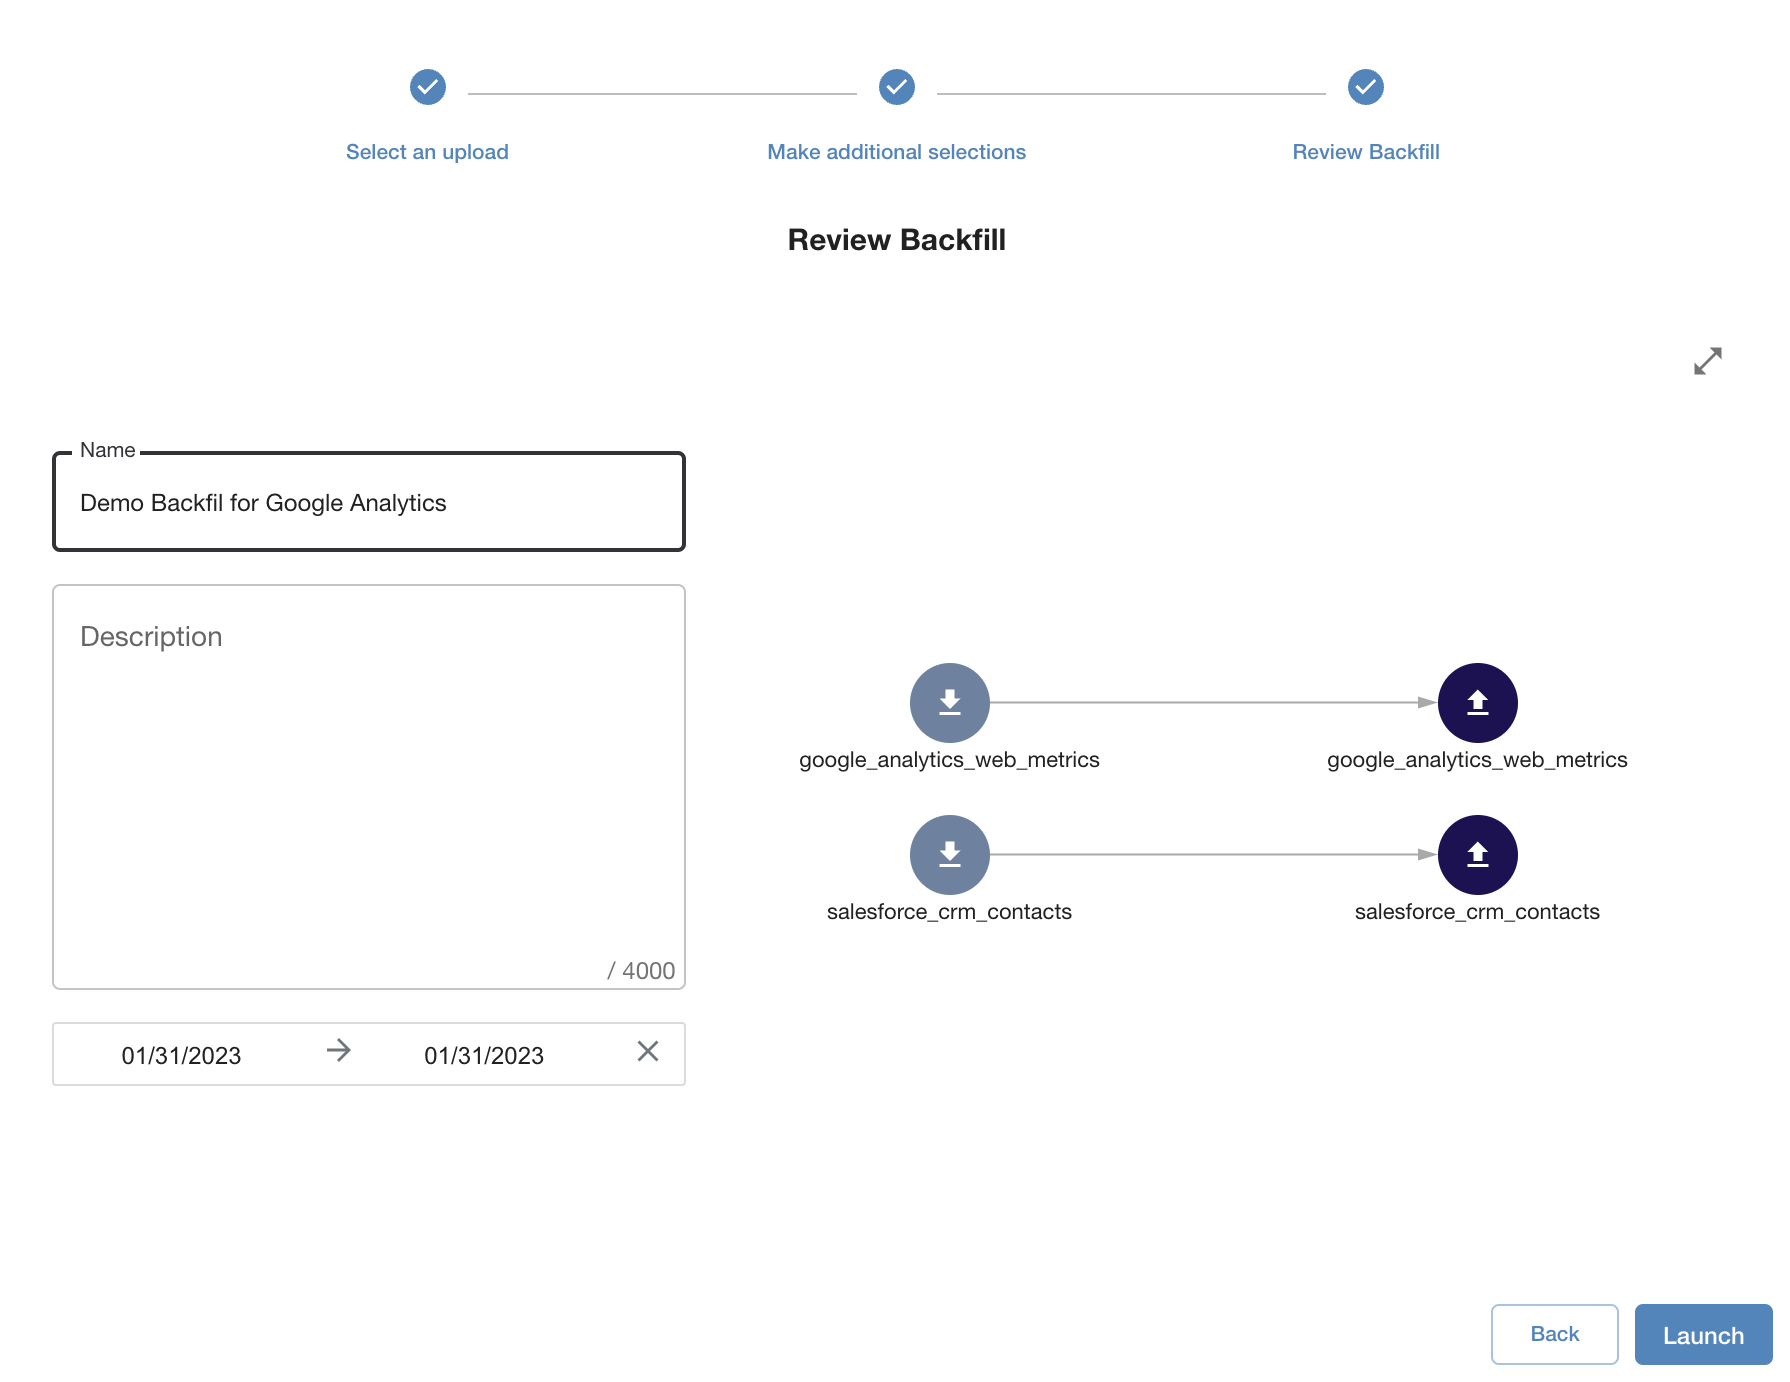
Any changes you have made in terms of sources and destinations will be reflected in the review screen at the end of the wizard.
In order to launch your backfill you must provide it with a name to identify its execution within the user interface.
You may also provide an optional description. You can use this field to provide some additional context as to why you are running the backfill.
To begin backfilling your data click the “Launch” button.
Your backfill will run in the background and will be shown as being in progress until it completes.
Backfill Details
For each backfill you create, you can click on it to see additional details about the backfill, such as who created it and when.
From here you can also see more details about connections, runs, and messages.

The current status of the backfill will be shown in the upper right hand corner. The backfill may be in one of the following states:
Preparing The user filed this backfill, and the backend is probing sources to determine which downloads match.
Running The backend is running related workflows to download the data from its various sources.
Canceled The user stopped this backfill.
Completed The backfill finished all pipelines.
Canceling Backfills
If the backfill is still preparing or running, you may cancel it from here by clicking on its status in the upper right hand corner.
Note that canceling will cancel anything “in flight,” but if anything has already been sent to the data warehouse, canceling will not remove it.
Connections
The Connections section allows you to review the same graph showing the relationship between sources and destinations that was displayed in the last step of the workflow for creating a backfill.
Runs
The runs section allows you to see the status of data as it’s imported. This section provides the status of the workflow for obtaining, processing, and storing the data as it happens.
Completed steps are shown with green icons. In progress steps are shown with blue icons. Steps that have not yet been started are shown in gray.
You can drill down even further by clicking on the unique identifier for the run.

Messages
The messages section is a detailed log for each step that Switchboard takes as it obtains, processes, and stores the data from the scripts it is executing.
It is here you can locate details about issues encountered during these steps.
Note that Switchboard will attempt to retry downloading data if it encounters an issue. If it is marked as failed, user intervention is required.
Downloads that are marked as abandoned indicate that the download was stopped as part of Switchboard’s normal course of operations. For example, the import was removed from the SBS pertaining to the download before it completed.